
MarketMap™
The topping process began with crypto on October 9, 2025. Now the Nasdaq leads lower and the blue chips follow.

Nasdaq Leads, Blue Chips Follow
The all-time high fractiles that preceded prior cyclical and secular bear markets are already on the record here. No need to rehash them. The chart below shows the Nasdaq sitting on the right-hand side of the all-time high pivot, intimating that a new cyclical bear market, and possibly a secular one, has begun. Same proportion as the two great bears that followed the dot-com bubble and the 2007 real estate bubble.
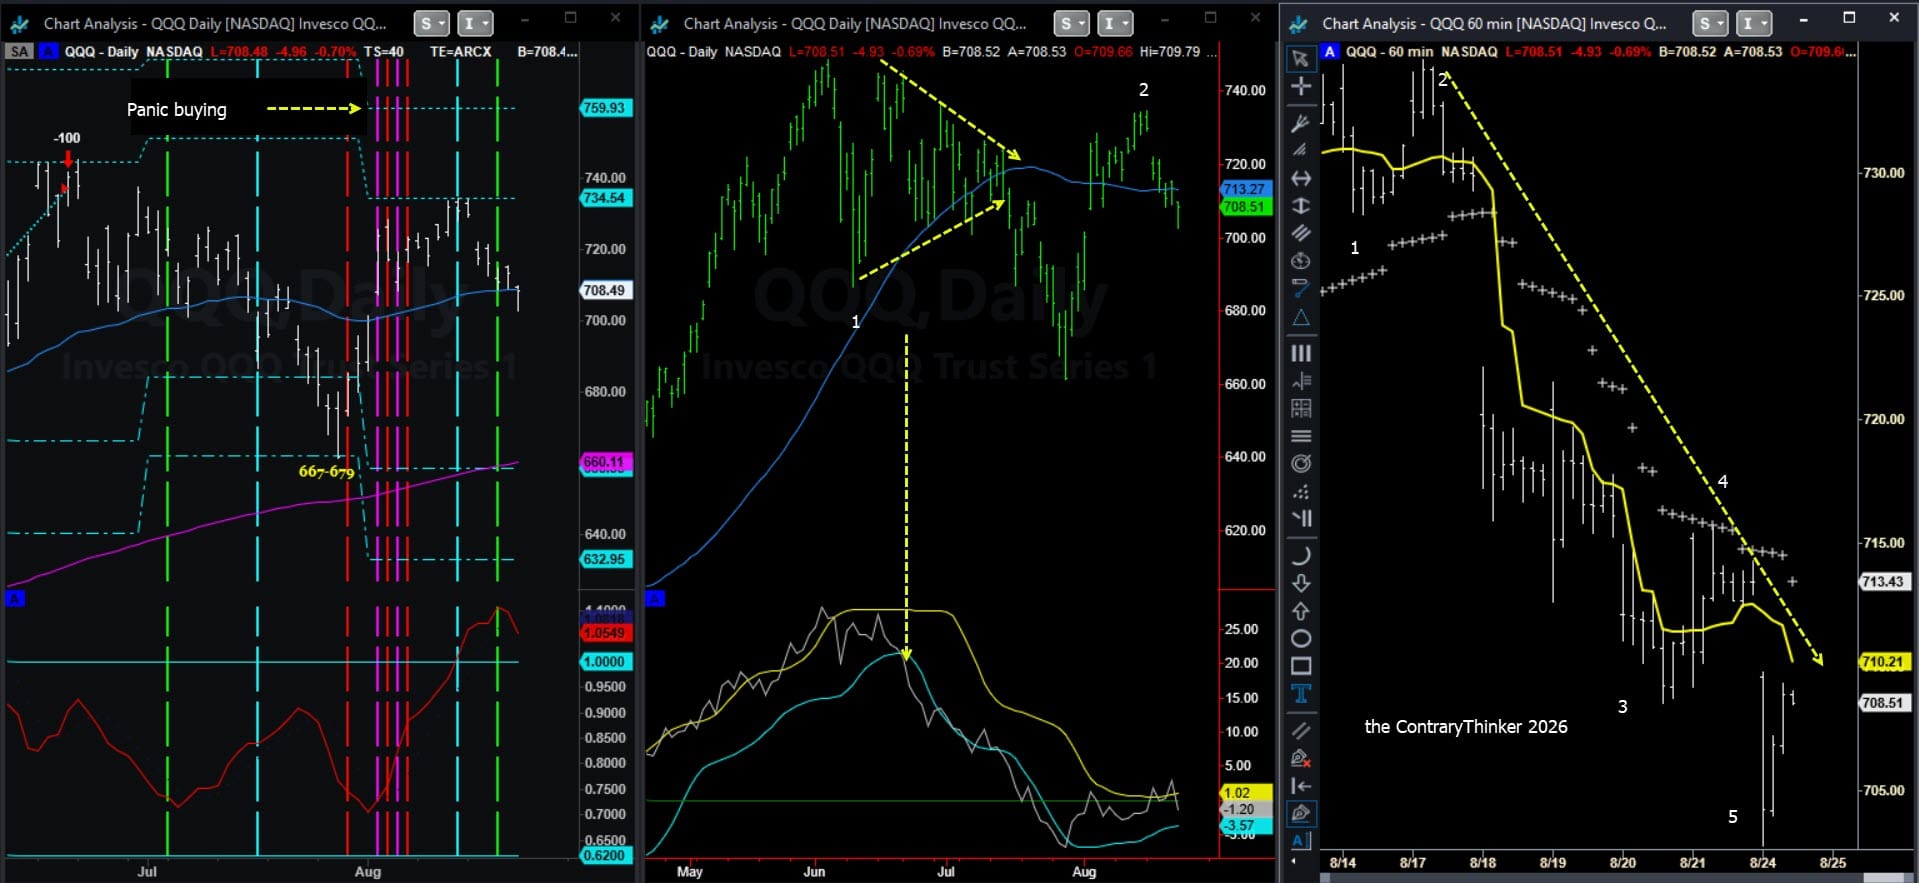
The topping process did not begin this month. It began with cryptocurrencies on October 9, 2025, and it has been distributive across the risk-asset complex ever since. The over-the-counter Nasdaq, home of the high-tech hyperscalers, posted its all-time high back in June. The blue chips came later. The Dow reached its all-time high on August 5. The March low came in on March 30. The Nasdaq low came in on June 10.
That sequence matters more than any single price. It is the 2000 pattern: the Nasdaq tops first, then the blue chips top months later. In 2000 the Nasdaq went into a ninety percent correction and the Dow topped three months behind it before entering the trading range that preceded the September 11 debacle. The outcome does not have to repeat. The timing signature is what repeats, and it is holding true again this cycle.
The scenario maps
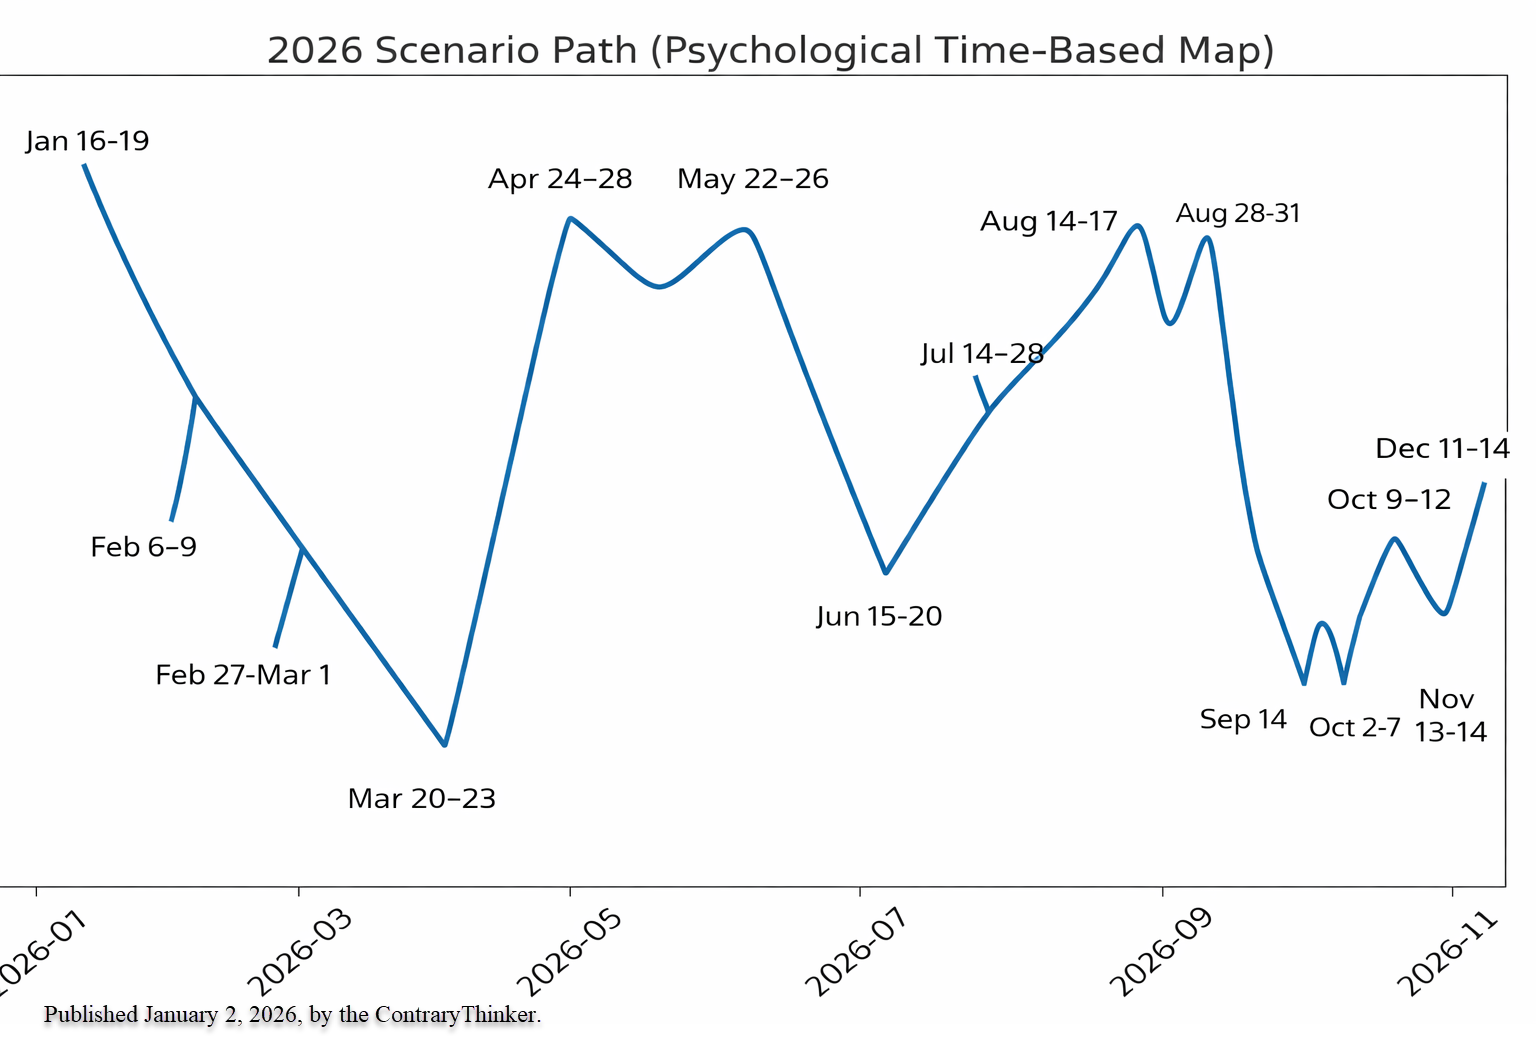
The two maps below were published January 2 and have been in subscriber hands all year. Go back and check them against the Dow for the year. The Change of Trend (COT) dates line up.
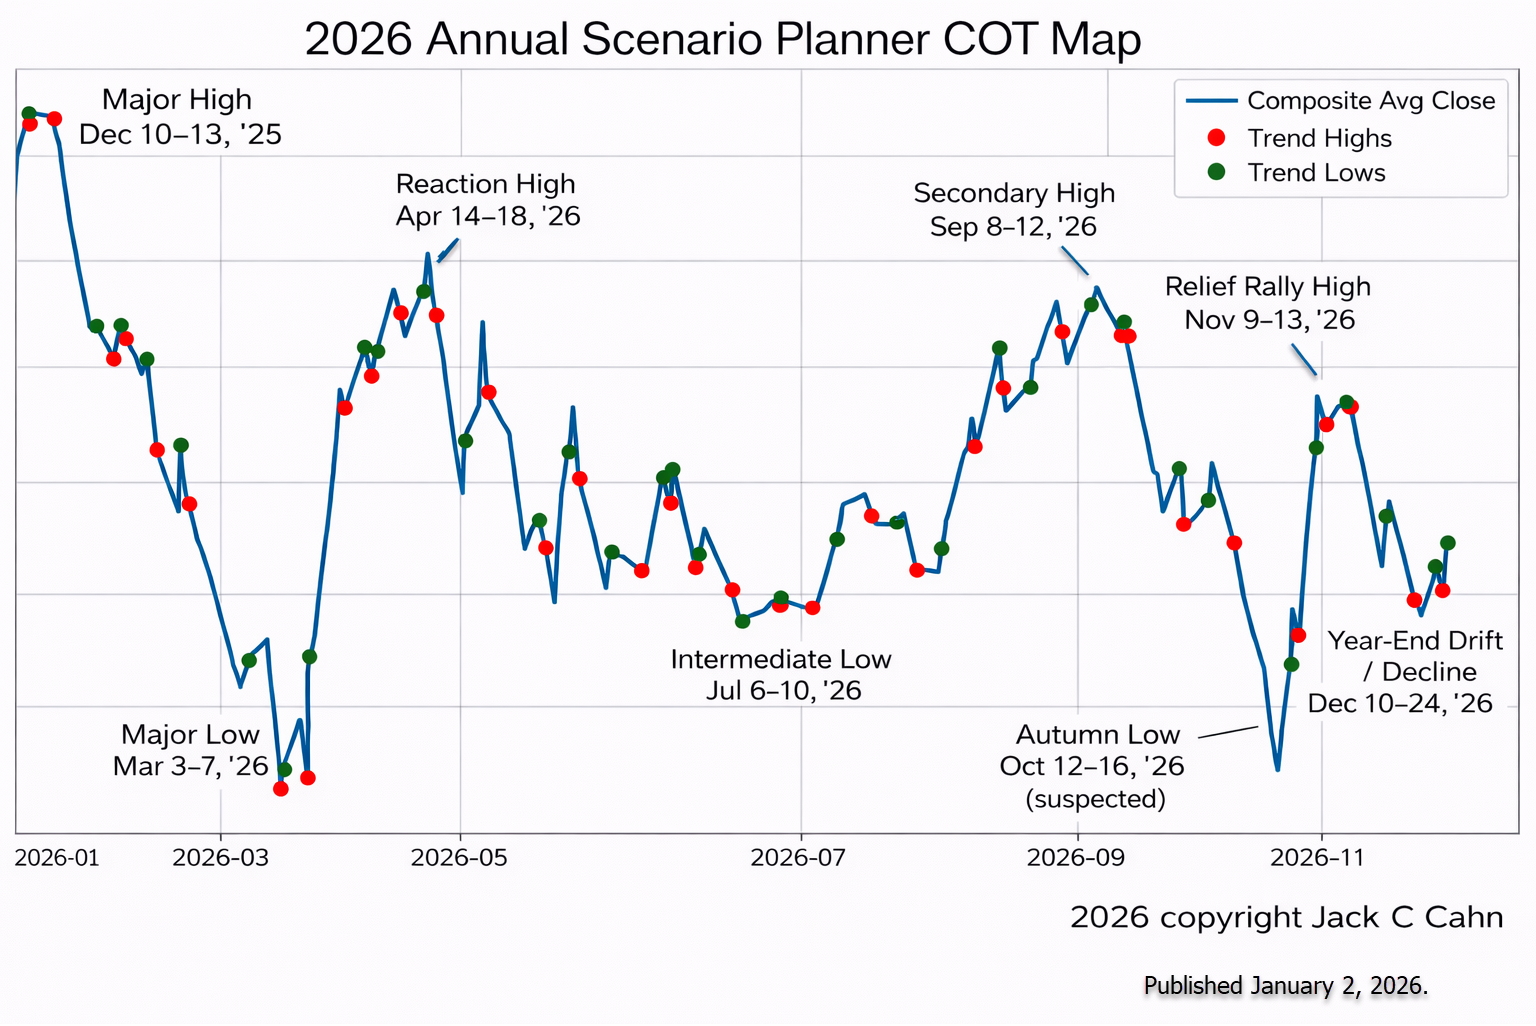
These are date windows, not price levels. They identify timing and trend direction between turns. That distinction holds regardless of how the tape fills them in.
The color, not the form
What follows is mentality of economic policymakers based on astrological theory. It is the color that fills the shape the market has already drawn. What's important to our operators and traders is what this volatility reflects.
Mercury in Cancer square Neptune, Mercury in the eleventh house of allies and cronies, Neptune in the second house of money.
That is the signature of a policymakers who moves markets by talking, who blurs fact and fiction inside the news cycle, and whose wealth flows through illusion. Crude oil is Neptune's commodity. Threaten war, walk it back, harvest the swing. It works because nothing heavy currently presses on that square.
That condition is ending. Saturn and Neptune in early Aries are moving to activate the natal Mercury-Neptune square by T-square. When Saturn arrives, the bill for every Neptune game gets presented.
The first crack is August 25. Transiting Mars conjoins natal Mercury at 8 degrees 51 minutes Cancer, triggering the natal square directly. A headline play made on or around that date gets contradicted by actual events within days. A tip-off, not the collapse. Watch it as confirmation that the sequence is live.
That should be the secondary high that we have outlined in the all-time high fractiles at the beginning of the intermediate-term trend that should sustain for a good 4 to 5 weeks.
The good luck that has sustained the on-again, off-again policymaking runs out between October 2 and October 16. Mars enters the twelfth house October 2, opposes Pluto exact October 4, and hits natal Pluto October 16, one day after Pluto stations direct. This is where a covert market play meets a counterparty or an event outside the control of the White House. Iran, the Strait, an OPEC actor, a leak. The twenty-four hour cycle stops responding to the script. That window converges with the October 3 Mars-Pluto negative attractor (negative attractors would do as you would expect, and that would be to pull the market down towards it, whereas a positive attractor would do just the opposite) and the October equity corridor. It is our working assumption that the market mentality and the White House mentality are running in parallel. With that being the case the market breaks in the same time window as the administration's tactical games break.
The terminal window runs December 11 through December 26. When investors and traders may expect an intermediate-term low pivot
Saturn stations direct December 11 at 7 degrees 55 minutes Aries, exactly square natal Mercury and within roughly two degrees of opposing natal Neptune, completing the T-square on the exact configuration he games with. Jupiter stations December 13 parked on natal twelfth house Mars. Saturn stationary on the Mercury-Neptune axis is the aspect of the fabricated narrative that becomes evidence: the recording that surfaces, the crony who flips.
The verbal manipulation machine seizes up. It happens alongside the December 12 Neptune station, the crude oil and inflation anchor. The oil game and the oil regime confirm each other inside the same seventy-two hours.
The sequence reads clean with the Economic policymakers first public contradiction hitting on August 25; trending into broader losses that control the the stock market October 2 through 16. The scenario would suggest that the low at the end of the year will take out the October. We'll be looking for lows on or about December 11 through 26.
This week
Coming into this week the expectation called for a short-term low last Friday. That low arrived on cue. The minor consolidation continues today after a mixed-to-weak open, Dow up and Nasdaq down. Same character as the pattern described above.
The big picture is in place. Today's rebound is the opportunity to initiate new short exposure. Four new positions have gone out through the Slack delivery system. Entry, exit, and stop mechanics are in Strategy and Tactics. What you are reading is the forecast and analysis behind them.
Upgrade to Strategy and Tactics
Contrary Thinker. Jack F. Cahn, CMT+, editor and analyst. In markets since 1974. Copyright 1989 to present. Analytical methodology: price analysis via Elliott Wave Theory (MarketMap™), Quality of Time models, volatility modeling via the Technical Event Model, and contrarian sentiment. Offices: Palm Springs, California and Mooloolaba, Queensland.
- This publication is editorial commentary and market analysis, not personalized investment advice.
- No content herein is a solicitation or recommendation to buy or sell any security, commodity, or instrument.
- Trading and investing carry substantial risk of loss. Past performance does not guarantee future results.
- Readers are solely responsible for their own decisions and should consult a licensed professional before acting.
Timestamp: August 24, 2026, 11:52 AM ET