
MarketMap™
Warsh refused forward guidance at Jackson Hole and named what he watches: Treasuries, the dollar, credit spreads, commodities. So should you.

The Backstory: The Chairman After My Own Heart
Kevin Warsh, chairman of the U.S. Federal Reserve, gave his first Jackson Hole speech Friday and refused to tell anyone what he intends to do. The content providers read that as evasive. It isn't. Warsh has spent his entire career arguing against forward guidance, on the grounds that when the Fed announces its intentions, markets stop analyzing the economy and start analyzing the Fed. He shut off the transmitter and turned up the receiver. He then named exactly what he is listening to: Treasury prices, the dollar, credit spreads, and commodities. He sounds like my replicant.
That is what a good FRB chairman does. He follows what the markets tell him, and he does not tell the markets what to think. And from everything we've said in our dispatch, that's exactly what the Fed has to do, because the markets tell the Fed exactly what it needs.
Which puts him 180 degrees opposite his colleague at Treasury. Scott Bessent, the U.S. Treasury Secretary, has spent August doing the reverse: at least doubling long-end buybacks to $4 billion an operation beginning September 9, and stepping in earlier in the month to help support the Japanese yen.
Scotty's stated reason is that yields don't reflect fundamentals. In other words, the Fed chairman wants honest market signals and the Treasury Secretary is editing the feed, on a schedule that happens to line up with the midterm calendar.
Warsh's fifth principle (short rates are the tool, unconventional policy sparingly if at all) was a quiet repudiation of precisely the Treasury's stated policy. That should be intuitively clear to all of my readers.
And here's the kicker. The market has been placing its hopes on Bessent. That is the wrong point of view. Our expectation is that traders come around to reading what the markets themselves are saying and stop waiting on an intervention that cannot hold. The price action is the honest witness here, and it is the one Warsh is reading. As we've not been too shy to repeat, no administration, no central bank is ever bigger than the market, ever.
And on the fiscal side, there is only one thing that helps: tax hikes and spending cuts. Not popular, not likely, but it's the only lever left that isn't a manipulation. What a new fiscal policy would do is a long-term fix versus very short-term band-aids and decoration.
For investors and for traders, what's more important is what the markets are saying right now in the forecast for the coming week and the month of September. Here's what the markets are actually saying this week and the month of September into early October.
The Quality of Time from Here into October
Three independent methods stand behind our timing model. The first is our proprietary time compression work. The second is historical parallelism, the study of how markets have behaved during prior occurrences of the structural conditions now in force. The third is cyclic timing drawn from the synodic relationships between the planets, the fixed astronomical intervals at which two bodies return to the same geometric angle. Those intervals are measurable quantities, and the market's tendency to turn near their recurrences is something we test rather than assume.
We call this the quality of time, and what it describes is the collective mentality of the market, the mood in which participants make their decisions. Every date below has been verified against ephemeris before it entered this page, and every time is New York zone.
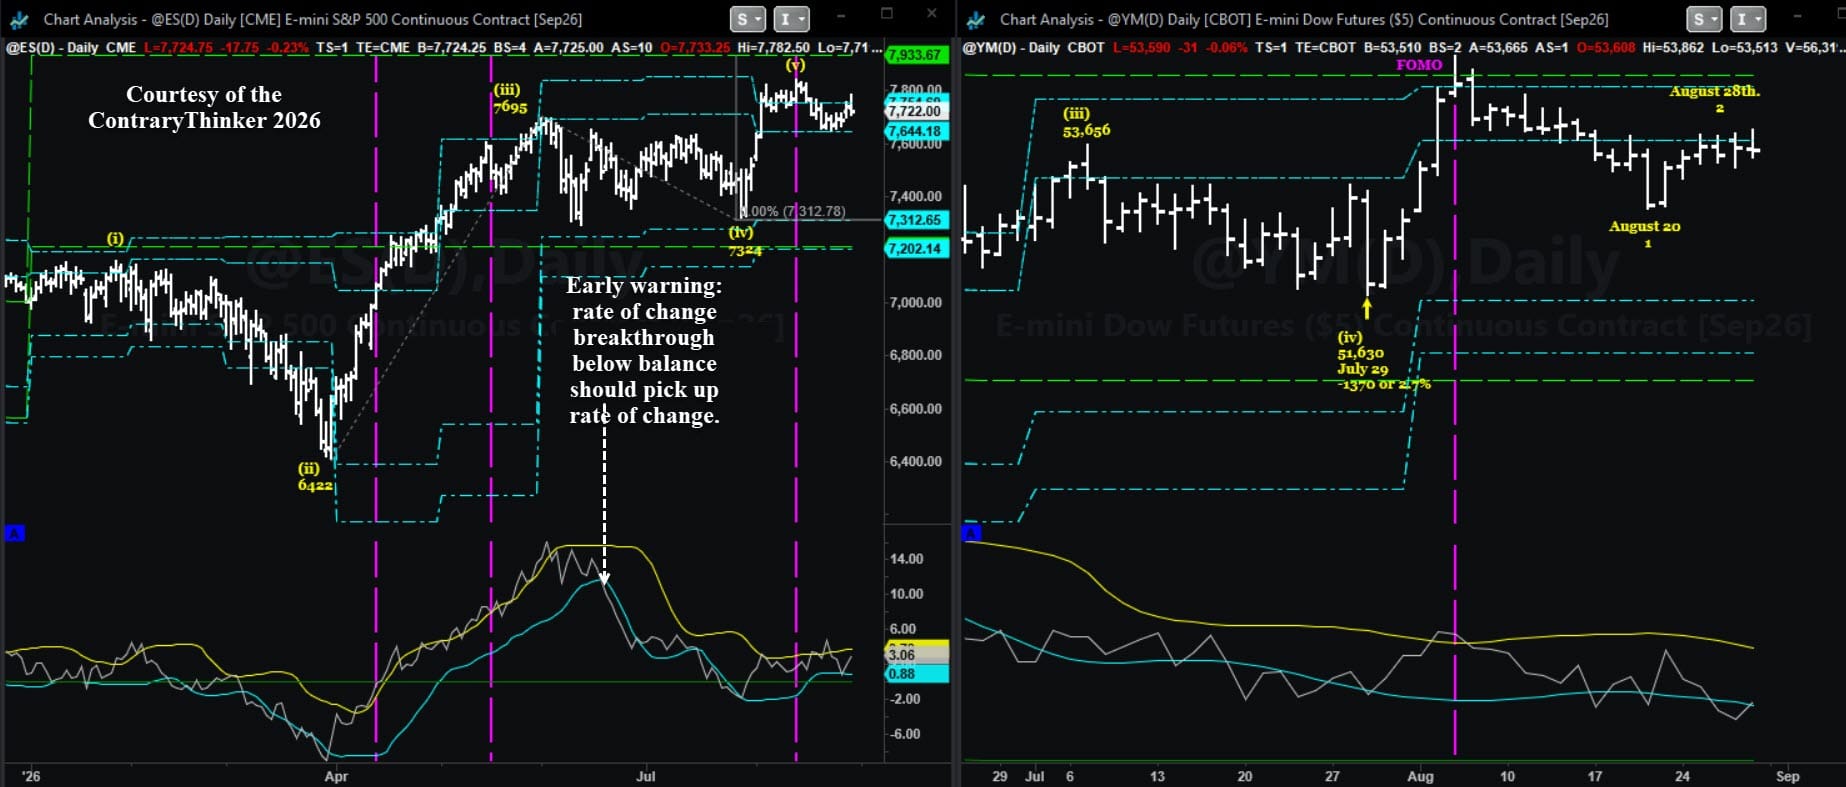
The structure we are working from is evident. The all-time high is in place across nearly every major index. Our benchmark is always the Dow, which made its all-time high on August 5. The low of August 20 was the initial leg down into a near-term pivot, and the market rallied into a secondary high on Friday, August 28, which is exactly where our change-of-trend corridor called for it (August 25) and which sits well inside the right-hand shoulder of the August peak. That is the shape of a lower high in a downtrend, and the working assumption from here is lower highs and lower lows.
After the all-time high and entering a new bear market. Furthermore, based on our rules, any day we should receive a confirmation of that, and it could be as early as Monday, based on price.
Monday is the bulls' last chance. And this is where contrarian thinking is always applied, because the following is an extreme, optimistic aspect, what our old friend Archie used to call a positive attractor. Jupiter forms a trine to Saturn Monday evening, August 31. That would provide the liquidity for smart money to sell into. It has always been one of our working rules. To compound the bulls' problem, roughly twelve hours later, early Tuesday, September 1, Mars squares Saturn. The mood into that trine is confident, expansive, forward-leaning, and it will be marketed as the beginning of something. It is not. In fact, as we go to press here, we just heard on NPR that the White House has struck a deal with Venezuela to access its oil reserves, which the market should interpret as putting a cap on inflation. And as restated, it is not.
A market advancing into that combination is a market walking into a wall, and the geometry that follows belongs to the sellers. Trend into the aspect decides the outcome, and the trend here is down. Treat any strength Monday and Tuesday as the last distribution the bulls will be given.
The dominant time window of September is the tenth through the fourteenth. Uranus turns retrograde on September 10, and on the same day Venus and Mercury both change signs. The new moon follows late that evening, and Mercury then runs across Pluto, Neptune and Uranus on the twelfth and thirteenth. Direction changes in the outer bodies are the heaviest events on any calendar, and what they historically produce is the failure of technical support and resistance that everyone is watching.
Our expectation is a lower high on Friday with the new moon, September 11 (as you know, we're able to test that concept in TradeStation, which gives us a 6% edge to be exactly correct on the date of the new moon for a high pivot), or on Monday, September 14, and we want to be precise about what that high is. It is a lower high in the S&P and the Dow.
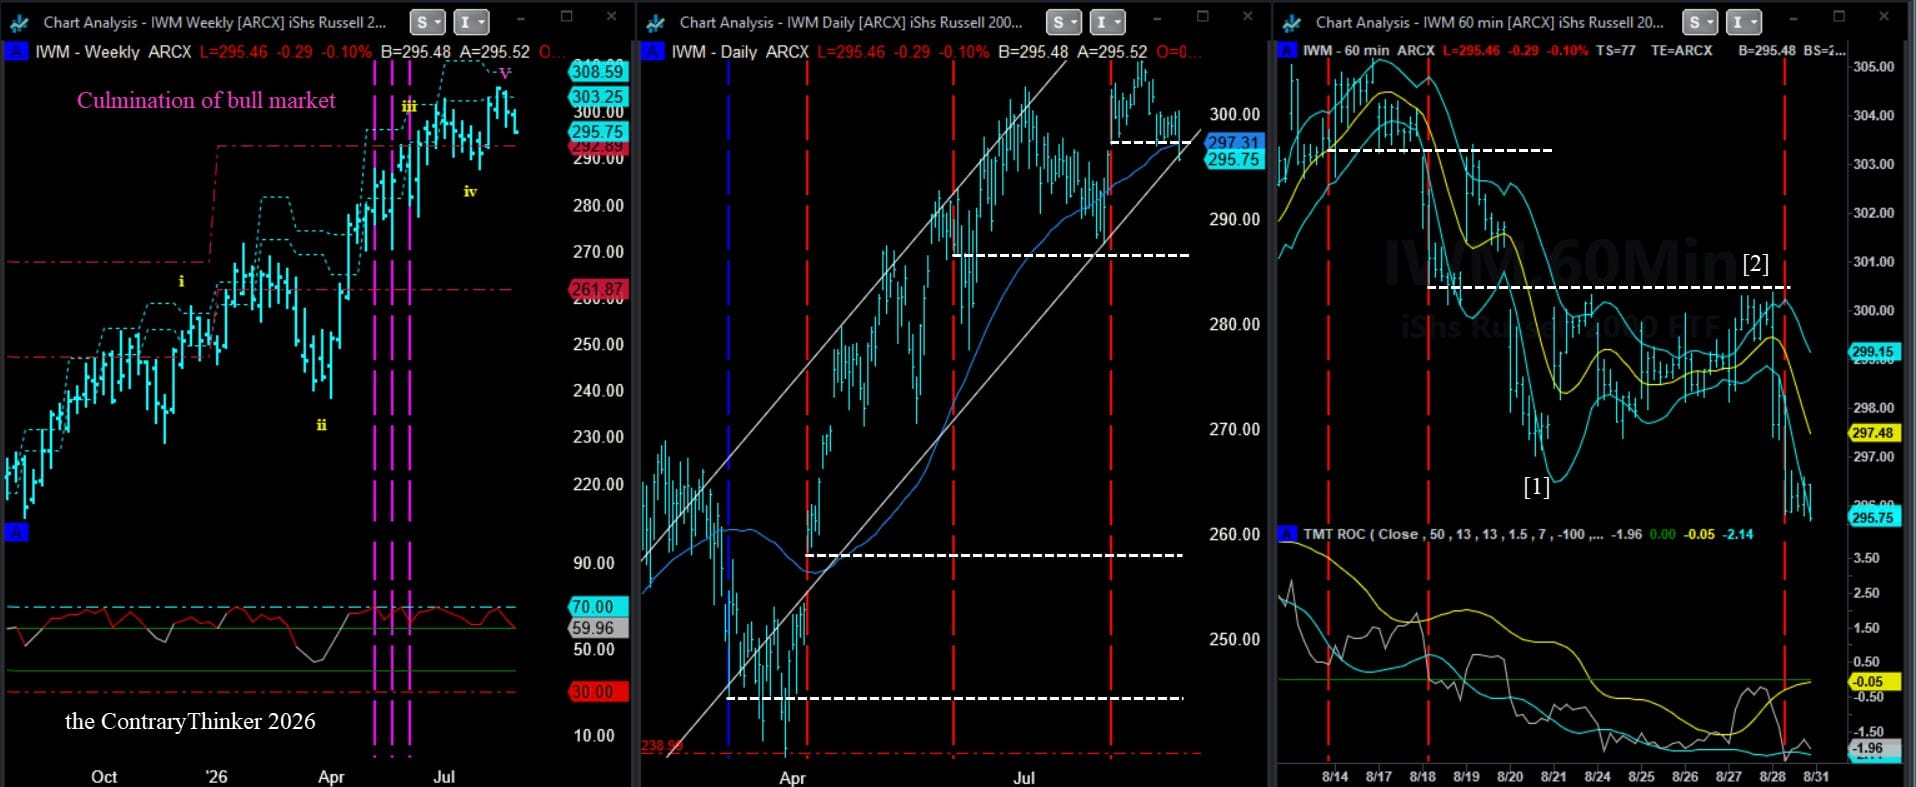
There should not be much of a recovery in the small tech or high-tech complex, in the semiconductors, or in the Nasdaq issues. It may only be a pause at best, and we have seen this kind of action before, where the Dow Jones has held or rallied while the high tech and the QQQ have continued to go down. So, given the influence of this collective mentality, we expect the high tech to be breaking to new lows while the headline averages are still printing green on the day. That divergence is a smokescreen, and it will not be reported as one.
The bank sector deserves separate mention. We have our eyes on all the major sectors, including the ones that are typically not monitored much. It has been the best-behaved group on the board, we said last week it had room for one more run, and it still does. A final push there, alongside a cooperative Dow, is the smokescreen. It will make the market look repairable at precisely the moment the leadership underneath has already broken. We are not persuaded by it.
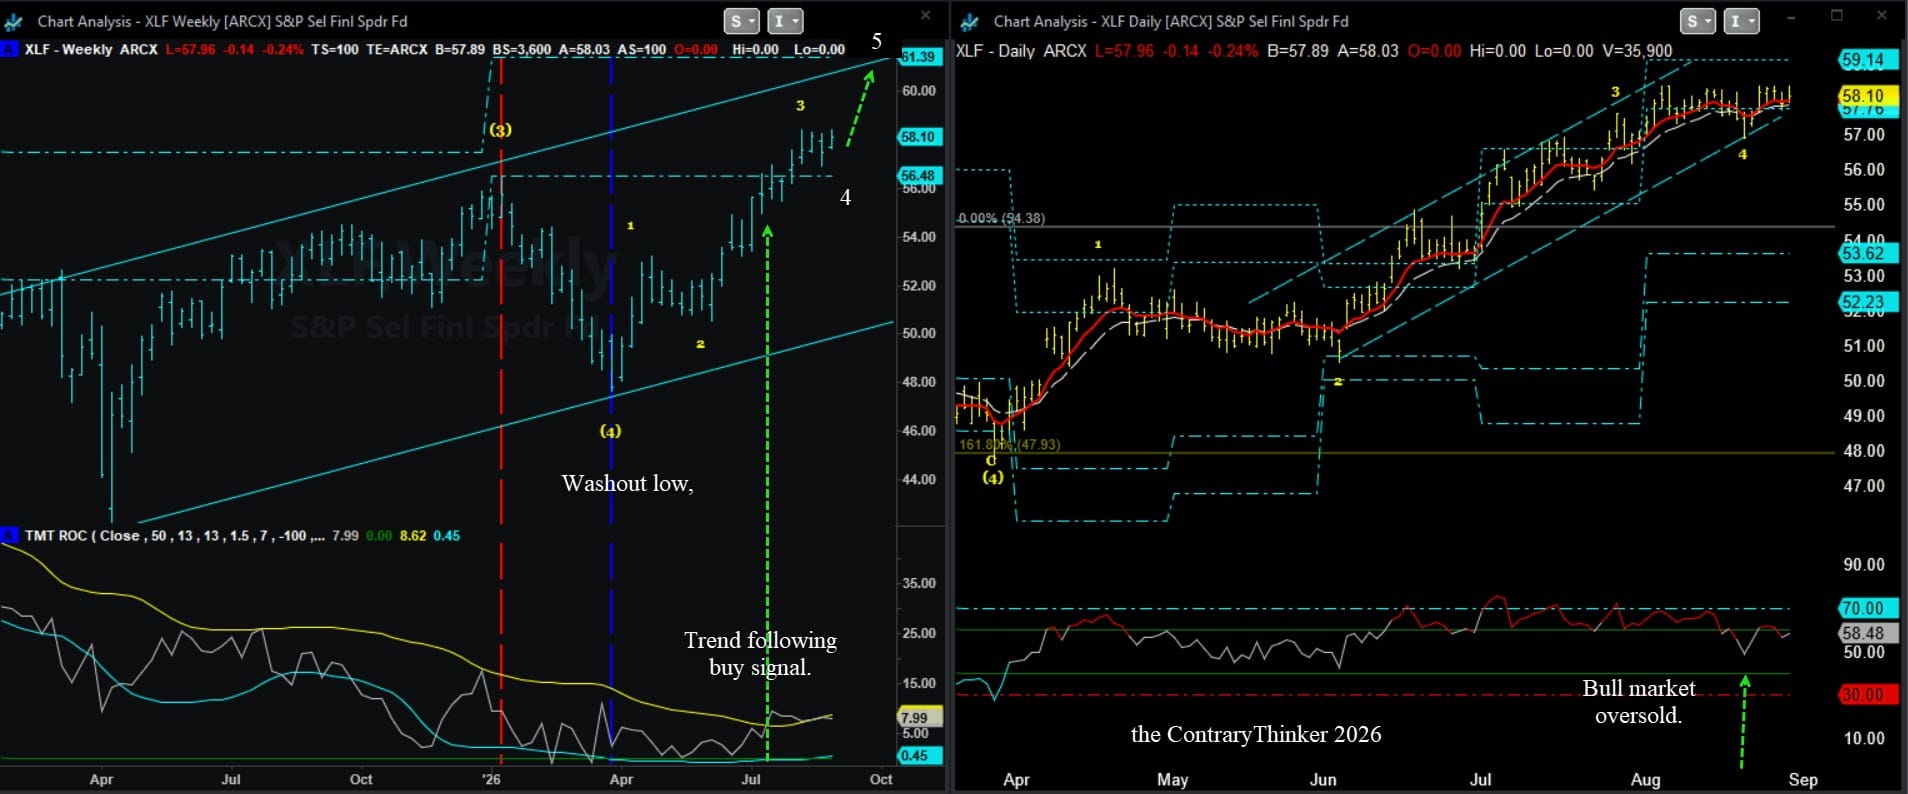
From the expected churning high early this week, August 31 and September 1, the market is expected to go lower. Venus squares Pluto on September 15 and Mercury opposes Saturn on September 18, and that pairing has the character of a sharp, compressed decline into a near-term low pivot. Nothing travels in a straight line, and one-day wonders happen in declines, so a snapback out of that declining trend channel should be expected and should not be mistaken for anything more. It is a pause inside a downtrend. The climactic low of any real proportion does not arrive in September.
The equinox (an important day for Gann traders) on September 22 opens the last act of the month. The full moon on September 26 sits with the Sun in easy relationship to Pluto and then to Uranus on the 28th, with Mars changing sign on the 27th. The mood there is aspirational and blurred at the same time, ambition without clear vision, and that is the psychology under which countertrend rallies terminate. We look for a tertiary high in the last week of the month that carries the averages nowhere, and we expect the technology complex to refuse to participate in it at all.
October is where market structure breaks down. Mars opposes Pluto on October 3, and Pluto turns direct on October 16 in the same time band, the two heaviest markers on the balance of the year standing thirteen days apart. That is the signature of a regime change rather than a pivot, the point at which the volatility environment stops being calm and starts being expansive, and where liquidity withdrawal, not news, not the backstory, does the work. Our expectation is a regime break in the first week of October. In trading terms, for volatility to break out, followed by a series of geometrically expanding lower daily ranges into the middle of the month, where the first in a series of climactic lows is expected.
The precious metals run on the opposite vector: magnitude and direction
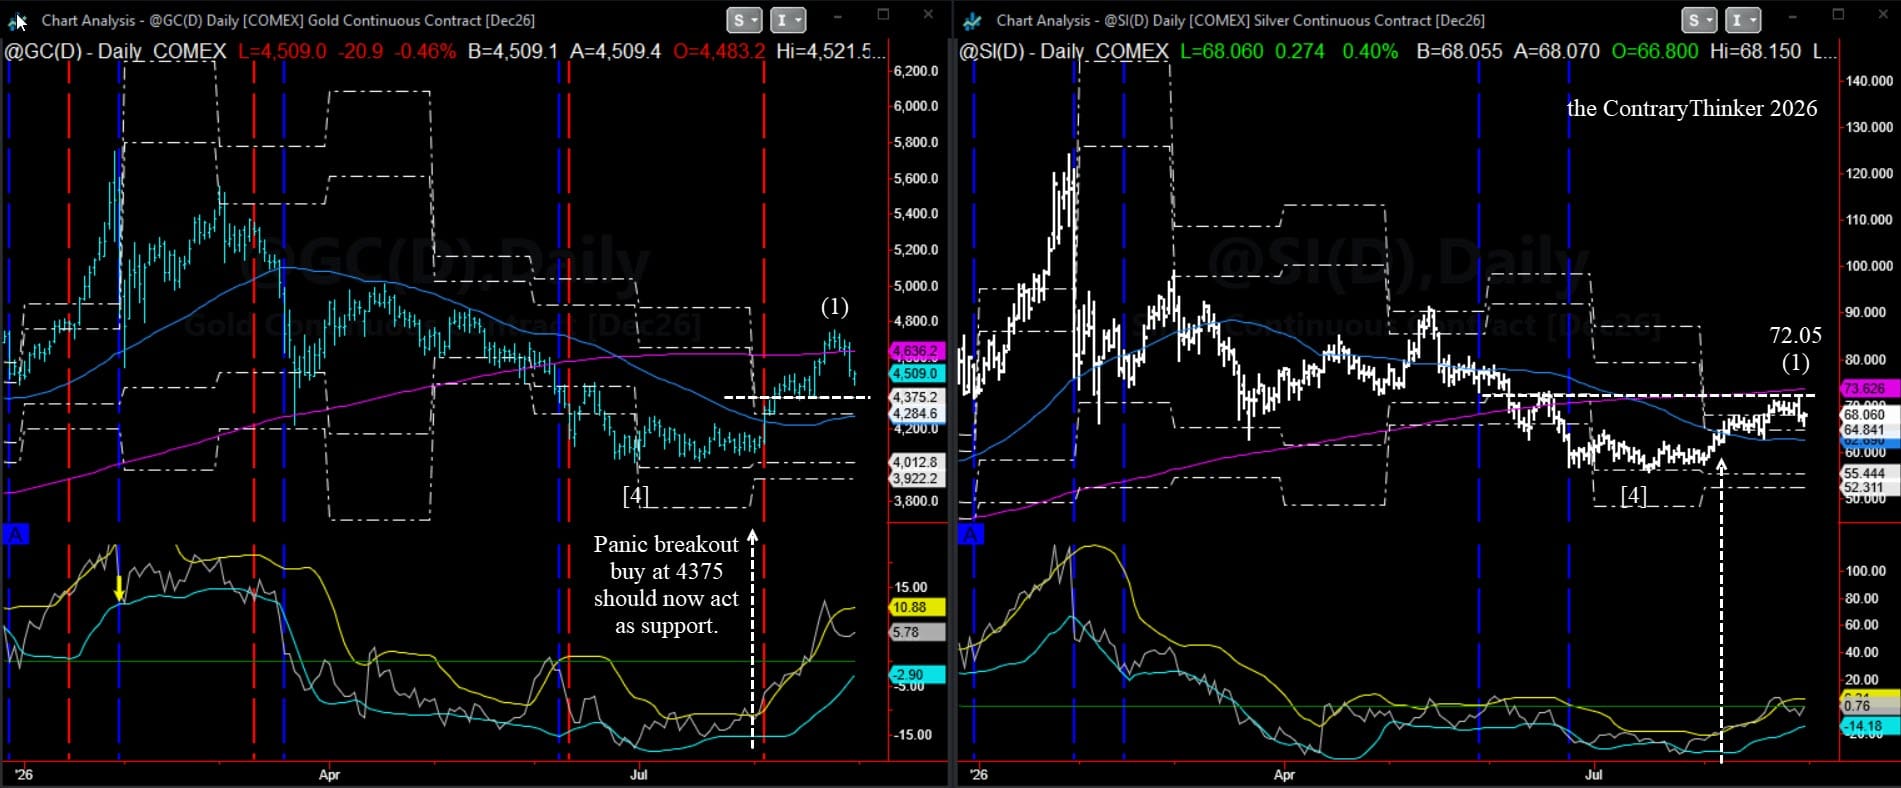
Gold and the precious metals are declining into a Jupiter configuration that we consider their primary bullish carrier through the middle of next year, and a market declining into that configuration is a market building a base rather than a top. We are constructive on the metals into the autumn on exactly the geometry that we read as hostile to equities. The intermediate-term target can be easily calculated at 1.618 times the length of intermediate-term wave (1), added to the low that posts up in the current time frame.
Carbon-based energy carries its own separate read, and the October window that ruptures equities is the same window that has historically delivered upside dislocation in crude. The 2026 Annual Scenario Planner for inflation and crude oil was bullish for the entirety of the year. That's from the beginning of 2026.
Summary, bottom line, as follows: A final distribution Monday and Tuesday, August 31 and September 1. Any pullback during the decline should result in a lower high on Friday, September 11, or Monday, September 14, made by the Dow and the S&P while technology breaks to new lows underneath. A sharp decline into September 15 through 18 and a bounce out of it that resolves nothing. A tertiary high in the last week of the month that fails well below August.
Regarding price, the monthly support and resistance zones recalculate this week during the first week of September. More on that in the next copy of MarketMap™.
A regime change to a volatility breakout in the first week of October and the climactic low of this leg in the middle of that month. The cycles suggest around October 16 through 19.
Contrary Thinker insuring your future in the global equity markets.
Great and many thanks,
Jack F. Cahn, CMT+
MarketMap™ 2026 Scenario Planner
Contrary Thinker™ since 1989
Copyright 1989-2026
All-inclusive analytical method: Astrological and Historical Cycles, Advanced Technical Analysis, Traditional EWT, Volatility modeling, Contrarian sentiment modeling. All empirically tested with technical methods hard coded and tested for validity.
the Contrary Thinker™ Strategy and Tactics.
1775 E Palm Canyon Drive, Suite 110- box 176
Palm Springs, CA 92264 USA
760-459-4681
OR
25/1 Poinsettia Court
Mooloolaba, QLD Australia 4557
614-2811-9889
- Client subscribers are responsible for keeping their payment details up to date and cancellations via the payment gate.
- Pricing is subject to change without notice. My indicators and strategies can be withdrawn for private use without notice at any time. Digital products are not returnable or refundable.
- Trading futures and options involves the risk of loss. Please consider carefully whether futures or options are appropriate for your financial situation. Use only risk capital when trading futures or options.