MarketMap™
Nothing is bigger than the market. The bond market always gets what it wants, and it is now demanding its price.

Nothing Is Bigger Than the Market
The Market Is the Final Authority
One thing you learn about the capital markets is that nothing is bigger than the market itself. Not one institution. Not one agency. Nothing controls what the market wants and what the market demands, except perhaps on a very short-term basis, and that does not apply only to the credit markets. The risk markets will demand their hedge against inflation, and once performance fades below the rate of inflation, individuals pile out of risk. The bond market is more demanding still. As the cliché goes, if reincarnation existed, I want to come back as the bond market, because it always gets what it wants.
That principle is the frame for everything that follows. Two developments this month put it on public display.
The Long End Is Not Taking Orders
Scott Bessent, the United States Treasury Secretary, has spent the past week attempting to engineer the long end of the Treasury curve lower. The market has answered him, and the answer is no.
Stan Druckenmiller, the American investor who built Duquesne Capital and who employed Bessent at Soros Fund Management, published an opinion piece in The Wall Street Journal rebuking the attempt in public. The substance of it: the long end is not the Treasury’s to set, and the machinery will not work.
That rebuke carries unusual weight. Bessent likes to present his critics as amateurs reading screens. Druckenmiller is the bond operator Bessent has always wanted to be, holds the respect of the investors who matter, was Bessent’s mentor, and compiled a far better record running his own money than Bessent did after leaving Soros. Bessent is pretending he does not know how markets work. Druckenmiller has told him he knows exactly what he is doing and that it is wrong.
The message is plain. Purchase as much yen as you please. Run whatever machinery you like at the front end. However ,you are owned by the 30-year bond.
Kevin Warsh, now chairing the Federal Reserve Board, is watching this closely, and he should be. The overnight federal funds rate can be lowered by decree. The independence of the Federal Reserve, which sits at the center of the global financial system, can be dismantled. Faith in the dollar and in American institutional integrity can be spent. None of that permits anyone to set the cost of borrowing. The market prices that, and it is pricing a risk premium against the debt, against the tax structure, and against a broad crisis of institutional credibility. That premium arrives as higher mortgage rates, higher car rates, and less business activity.
Warsh sits in a corner of his own. He knows what the administration wants from him and will not say so publicly, so he says the bond market is doing it for us. On that narrow point he is correct. The bond market is raising rates, nothing at the Treasury has stopped it, and 30-year rates are going up.
Leadership Shifts North
Leadership of the Western bloc, built on the values propagated at the founding of the United States of America, has shifted north to Canada. What that means for the risk markets remains to be seen. It is the context the risk markets must now play in. Call it the sandbox.
Mark Carney, the Prime Minister of Canada, said it plainly in January. The Americans cannot be relied upon. This administration wants to decouple from the West and to bully its allies without cause, and as a result the middle powers have to realign and think about things very differently.
He then did what no European leader and no British leader has done. Weeks of trade negotiation were ticking down to midnight on Friday when Carney told his team to walk. There was no deal to be had, and walking away was better than the alternative.
One senior European diplomat put the rules of dealing with the current administration as follows: flatter, be firm, and think of the future. Carney ignored the flattery and went straight to all business. and he has been building the future elsewhere, with 20 trade agreements signed in the past year. Chrystia Freeland, the former Deputy Prime Minister of Canada, was asked whether this is the rulebook other Europeans should follow. Her answer was that it is, and that it is long overdue.
This is the context the markets are now conversing in. The realignment is now a fact the markets have yet to factor in the uncomfortable
2026 Annual Scenario Planner
The January Fractal and the Rule of Contingency
What we - our group of investors and traders traders - have learned about the January Fractal, which we generate at the close of every calendar year and publish at the beginning of the next, is that its trend direction for the period is very accurate. Its change-of-trend pivots are highly visible to discern and equally accurate. We demarcate them by month and by quarter, and that method gives us a reliable time window within which to expect the change.
The direction of the change is always contingent on the existing real-time trend running into it. We call that the rule of contingency, sometimes referred to in psychotheory as inversions. But mostly the exception versus the rule.
In general, the trend forecast by the map is accurate. For example, the map we published on the inflationary outlook has held since the beginning of the year without a miss.
But more importantly, today the January Fractal for the U.S. Dollar is the one we want to show here, because it marks a dramatic change of trend at mid-year.
Our first rule is never to lie to ourselves. Since the beginning of the year we have expected a major shift in the direction of all the main market trends at mid-year. That is July 1. We are roughly 45 days past it and still inside the same time realm, allowing the map its normal leeway.
The January Fractal for the U.S. Dollar
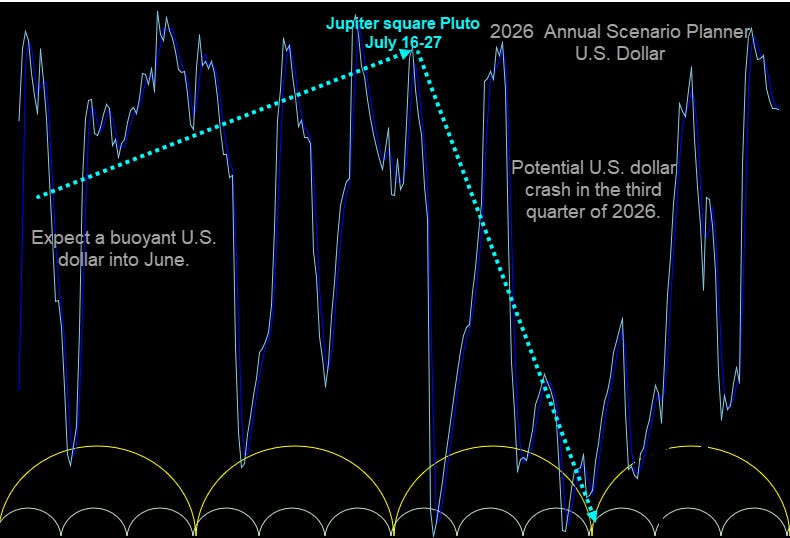
Chart 1. 2026 Annual Scenario Planner, January Fractal, U.S. Dollar. Capture metadata dated February 15, 2026. Annotations: a buoyant dollar into June, the Jupiter and Pluto configuration of July 16 to 27, and a potential dollar crash in the third quarter of 2026.
The metadata on this capture is dated February 15, 2026, which tells you when the projection was made. With no additional annotation on it, the map suggested a potential U.S. dollar crash in the third quarter of 2026. We are deep into that quarter. The fractal places a high pivot halfway through the third quarter, which is the current time frame, and the dollar goes into a downtrend from there.
We have been bullish on the U.S. dollar since 2011 and our bread is certainly buttered on that side. Yet today our method is now strongly suggesting a downturn coming out of the current period.
The editorial above sets out several of the reasons the dollar could pivot hard, and our read is the downside. While we’ve outlined some of the big-picture geopolitical influences above the markets, medias attention is on Jackson Hole this Friday, where the new chair of the Federal Reserve Board speaks, and that will carry its own impact. A great deal has stacked into this week: the inflation readings that came out yesterday, the hyperscaler earnings that came out yesterday, and now Jackson Hole.
Two Maps, One Pivot
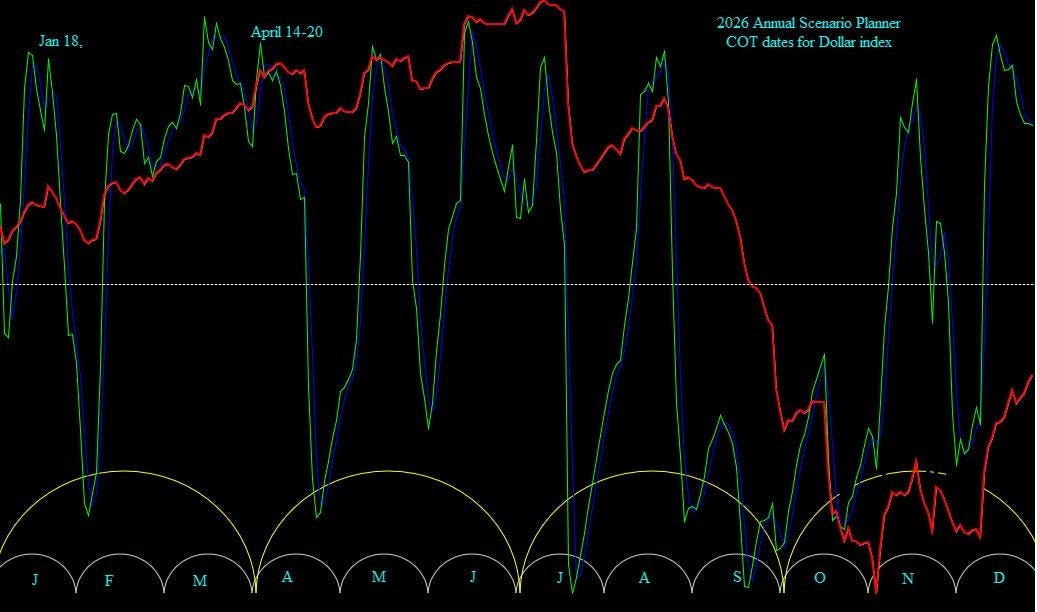
Chart 2. 2026 Annual Scenario Planner, change-of-trend dates for the Dollar index. The red line traces the realized trend against the fractal.
Here is the January Fractal again, this time with a different overlay where we have traced out the trend. You can see it in the red line. It too shows the high pivot occurring around mid-year, and more importantly a secondary peak in mid-August, which is the current time frame, with the market declining into early November. Two different maps built on the same underlying data put a pivot point right here, at August 27, 2026.
Looking back to the beginning of this great bull market in 2009, there is no correlation between bull and bear markets in the U.S. dollar and bull and bear markets in U.S. stocks. We can set that aside. Furthermore, the knee-jerk response, that interest rates rise and therefore the international flow of funds moves into the U.S. dollar, can be set aside as well. The correlation is critically disputed
The Dollar’s Own Structure
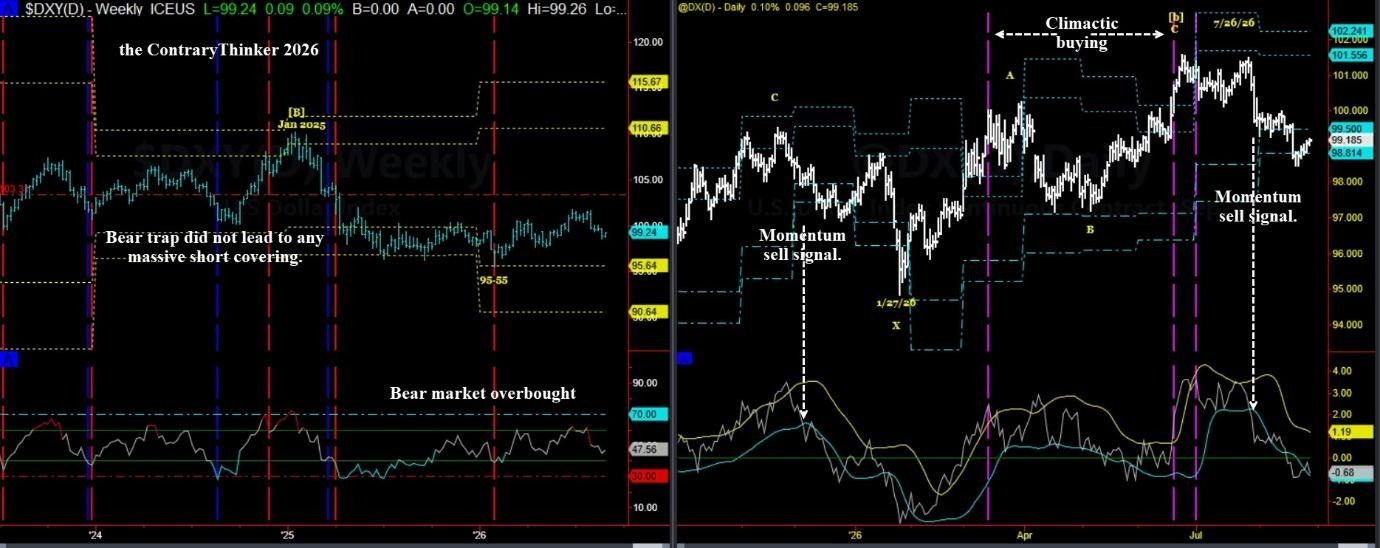
Chart 3. U.S. Dollar Index, weekly on the left and daily on the right. The weekly bear trap produced no meaningful short covering. The daily shows climactic buying into the July 26 high, with momentum sell signals on both time frames. That real pivot date ties into the January fractile seen above.
Our focus is the U.S. dollar and the likelihood of some type of event occurring in this time frame that sets off a collapse in it. That reaches the rest of the markets. On our independent studies, our forecast is for a decline in bonds, meaning an ongoing increase in the rate of interest. Any decline in the stock market is the beginning of a new cycle of the secular bear market.
Where the Inflection Sits
The bottom line we are working toward here is an inflection point across all the markets. On the dollar, we believe the inflection has already been seen on price: the nominal high posted in late June and early July. That corresponds to the January Fractal shown above, and it supports the outlook that the high coincided with the Jupiter and Pluto configuration from an astrological point of view. That is one more of our methods adding support to the current time frame as a major inflection.
Bottom Line by Market
Stock averages. Our bottom line remains unchanged. We believe the all-time highs are in for the major risk markets, with only one or two straggling segments, the banking and broker sector among them, remaining buoyant. Any sign of weakness entering that sector would be one of the final confirmation that a major turn has occurred. Please note that Volatility (the VIX) is a lagging indicator, based on recent experiences.
Confirmation discipline. We hold that reading, ATH August 5th, against the long bar day, which should not exceed 3.5%, until our 23-business-day count from the all-time high on the Dow Jones is complete. Another confirmation would be declines outpace advances on a sell-off day at a ratio of nine to one. Obviously, our systems will be monitoring the financial sector for an outright momentum breakdown sell signal.
Bonds and interest rates. Our outlook has not changed. The market will be increasingly demanding of a higher payout to offset its risk for inflation as well as currency risk, and that currency risk is reflected in the crash in the dollar.
Dollar versus the yuan. As a side note, our analysis of the Chinese yuan against the U.S. dollar continues to show the dollar in a sustained downtrend against the renminbi. And that downtrend be persistent and the rate of change increasing.
Precious metals. During a short-term deflationary spike lower in the Dow Jones and the S&P 500, we would expect some weakness in the precious metals as well. We believe that weakness will be short-term in nature only. The typical nature of a bull market is sharp and fast one-day or two-day shakeouts before the resumption of the uptrend. No rule of thumb is no 3 days down in a bull market.
Commodities and energy. We continue to be bullish on the commodity sector in general. Any deflationary spikes lower are temporary and present buying opportunities. We continue to be bullish on crude oil, natural gas, and all related carbon-based energies. We will focus on the buy opportunity in the incoming issues of Strategy & Tactics.
Contrary Thinker insuring your future in the global equity markets.
Great and many thanks,
Jack F. Cahn, CMT+
MarketMap™ 2026 Scenario Planner
Contrary Thinker™ since 1989
Copyright 1989-2026
All-inclusive analytical method: Astrological and Historical Cycles, Advanced Technical Analysis, Traditional EWT, Volatility modeling, Contrarian sentiment modeling. All empirically tested with technical methods hard coded and tested for validity.
the Contrary Thinker™ Strategy and Tactics.
1775 E Palm Canyon Drive, Suite 110- box 176
Palm Springs, CA 92264 USA
760-459-4681
OR
25/1 Poinsettia Court
Mooloolaba, QLD Australia 4557
614-2811-9889
- Contrary Thinker does not assume the risk of its client’s trading any type of risk vehicle, including futures and offers no warranties expressed or implied. The opinions expressed here are my own and grounded in sources I believe to be reliable but not guaranteed.
- Client subscribers are responsible for keeping their payment details up to date and cancellations via the payment gate.
- Pricing is subject to change without notice. My indicators and strategies can be withdrawn for private use without notice at any time. Digital products are not returnable or refundable.
- Trading futures and options involves the risk of loss. Please consider carefully whether futures or options are appropriate for your financial situation. Use only risk capital when trading futures or options.